
- 00 开篇词 打破四大认知局限,进阶高级性能工程师.md
- 01 性能工程:为什么很多性能测试人员无法对性能结果负责?.md
- 02 关键概念:性能指标和场景的确定.md
- 03 核心分析逻辑:所有的性能分析,靠这七步都能搞定.md
- 04 如何构建性能分析决策树和查找瓶颈证据链?.md
- 05 性能方案:你的方案是否还停留在形式上?.md
- 06 如何抽取出符合真实业务场景的业务模型?.md
- 07 性能场景的数据到底应该做成什么样子?.md
- 08 并发、在线和TPS到底是什么关系?.md
- 09 如何设计全局和定向监控策略?.md
- 10 设计基准场景需要注意哪些关键点?.md
- 11 打开首页之一:一个案例,带你搞懂基础硬件设施的性能问题.md
- 12 打开首页之二:如何平衡利用硬件资源?.md
- 13 用户登录:怎么判断线程中的Block原因?.md
- 14 用户信息查询:如何解决网络软中断瓶颈问题?.md
- 15 查询商品:资源不足有哪些性能表现?.md
- 16 商品加入购物车:SQL优化和压力工具中的参数分析.md
- 17 查询购物车:为什么铺底参数一定要符合真实业务特性?.md
- 18 购物车信息确定订单:为什么动态参数化逻辑非常重要?.md
- 19 生成订单信息之一:应用JDBC池优化和内存溢出分析.md
- 20 生成订单信息之二:业务逻辑复杂,怎么做性能优化?.md
- 21 支付前查询订单列表:如何分析优化一个固定的技术组件?.md
- 22 支付订单信息:如何高效解决for循环产生的内存溢出?.md
- 23 决定容量场景成败的关键因素有哪些?.md
- 24 容量场景之一:索引优化和Kubernetes资源分配不均衡怎么办?.md
- 25 容量场景之二:缓存对性能会有什么样的影响?.md
- 26 稳定性场景之一:怎样搞定业务积累量产生的瓶颈问题?.md
- 27 稳定性场景之二:怎样搞定磁盘不足产生的瓶颈问题?.md
- 28 如何确定异常场景的范围和设计逻辑?.md
- 29 异常场景:如何模拟不同组件层级的异常?.md
- 30 如何确定生产系统配置?.md
- 31 怎么写出有价值的性能报告?.md
- 我们这个课程的系统是怎么搭建起来的?.md
- 结束语 做真正的性能项目.md
- 捐赠
11 打开首页之一:一个案例,带你搞懂基础硬件设施的性能问题
你好,我是高楼。
这节课我要带你来看一个完整的性能分析案例的第一部分,用打开首页接口做压力场景,来分析下性能问题。通过这个案例,你将看到各种基础硬件设施层面的性能问题,比如由虚机超分导致的性能问题、CPU运行模式下的性能问题、IO高、硬件资源耗尽但TPS很低的问题等等。
如果你是从零开始做一个完整的项目,那么这些问题很可能是你首先要去面对的。并且,把它们解决好,是性能分析人员必备的一种能力。同时,你还会看到针对不同计数器采集的数据,我们的分析链路是不同的,而这个分析链路就是我一直强调的证据链,如果你不清楚可以再回顾一下第3讲。
通过这节课,我希望你能明白,有些性能问题其实并没有那么单一,而且不管性能问题出在哪里,我们都必须去处理。
好,不啰嗦了,下面我们就把打开首页接口的性能瓶颈仔细扒一扒。
看架构图
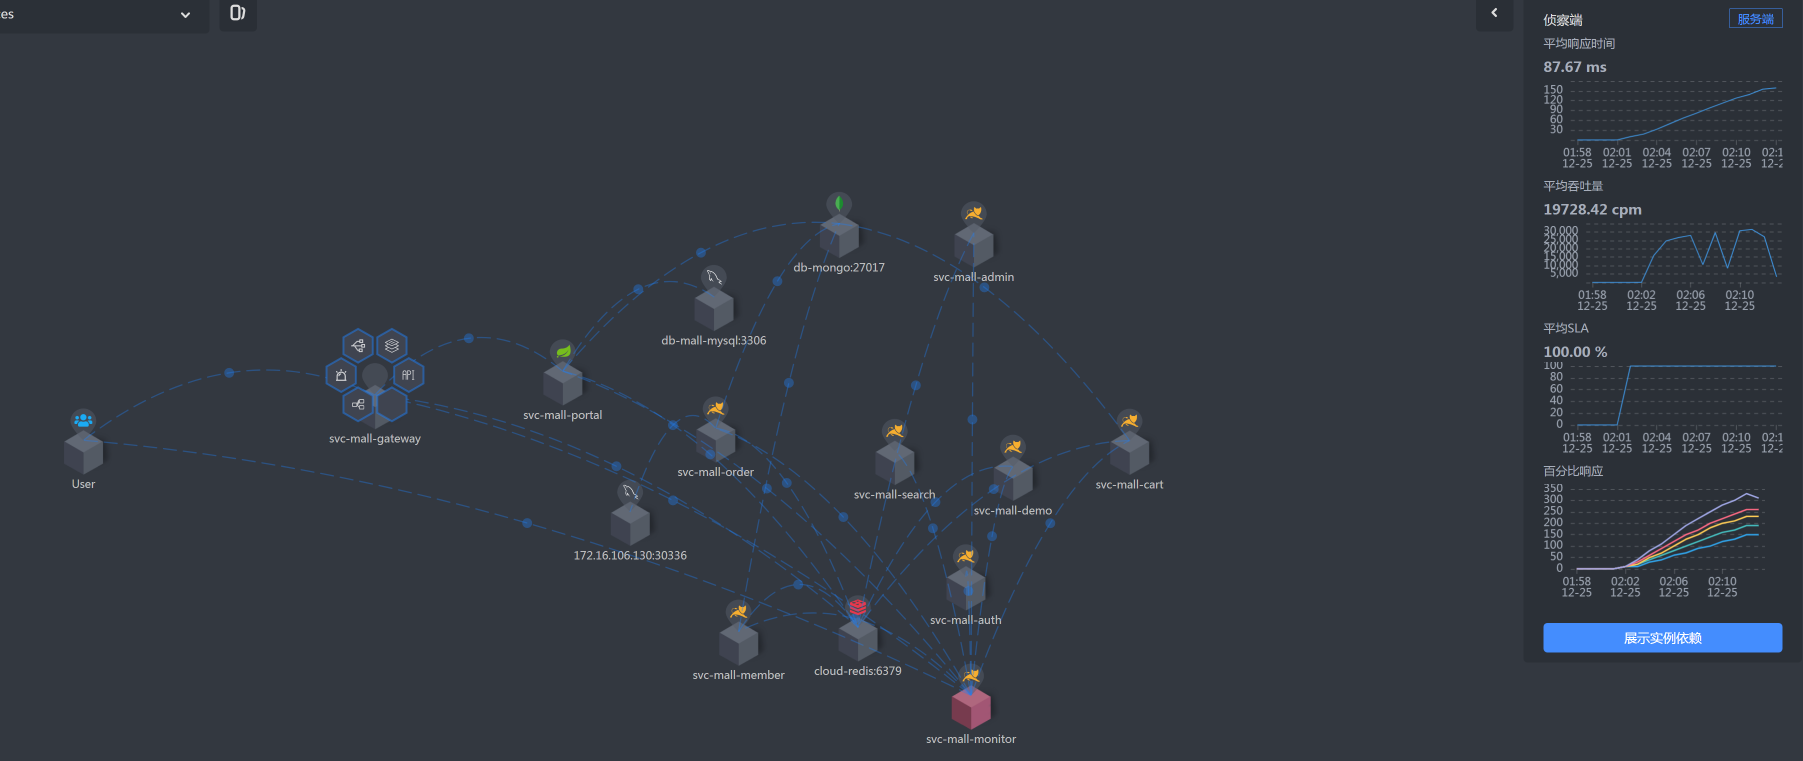
在每次分析性能瓶颈之前,我都会画这样一张图,看看这个接口会涉及到哪些服务和技术组件,这对我们后续的性能分析会有很大的帮助。
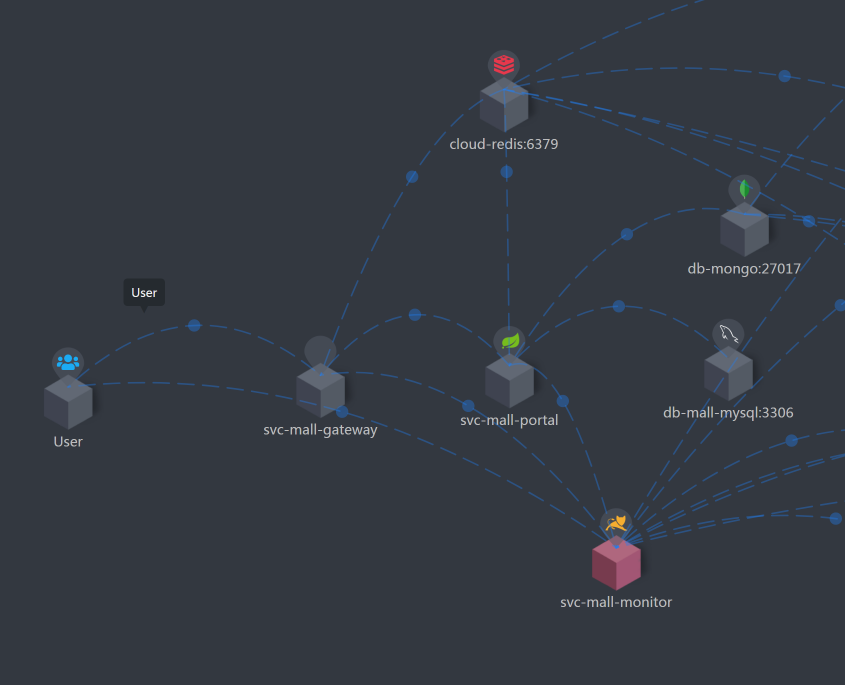
如果你有工具可以直接展示,那就更好了。如果没有,那我建议你不要自信地认为自己可以记住一个简单的架构。相信我,哪怕是在纸上简单画一画,都会对你后面的分析思路有很大的帮助。
回到上面这张图,我们可以清楚地看到这个打开首页的逻辑是:User - Gateway(Redis)- Portal - (Redis,MySQL)。
顺便看下代码逻辑
在做打开首页的基准场景之前,我建议你先看一眼这个接口的代码实现逻辑,从代码中可以看到这个接口在做哪些动作。根据这些动作,我们可以分析它们的后续链路。
这个代码的逻辑很简单,就是列出首页上的各种信息,然后返回一个JSON。
public HomeContentResult contentnew() {
        HomeContentResult result = new HomeContentResult();
        if (redisService.get("HomeContent") == null) {
            //首页广告
            result.setAdvertiseList(getHomeAdvertiseList());
            //品牌推荐
            result.setBrandList(homeDao.getRecommendBrandList(0, 6));
            //秒杀信息
            result.setHomeFlashPromotion(getHomeFlashPromotion());
            //新品推荐
            result.setNewProductList(homeDao.getNewProductList(0, 4));
            //人气推荐
            result.setHotProductList(homeDao.getHotProductList(0, 4));
            //专题推荐
            result.setSubjectList(homeDao.getRecommendSubjectList(0, 4));
            redisService.set("HomeContent", result);
        }
        Object homeContent = redisService.get("HomeContent");
        // result = JSON.parseObject(homeContent.toString(), HomeContentResult.class);
        result = JSONUtil.toBean(JSONUtil.toJsonPrettyStr(homeContent), HomeContentResult.class);

        return result;
}
我们可以看到,这里面一共调用了6个方法,并且这些方法都是直接到数据库里做了查询,如此而已。
确定压力数据
了解完代码逻辑后,我们上10个线程试运行一下,看看在一个个线程递增的过程中,TPS会有什么样的趋势。
运行之后,我们得到这样的结果:
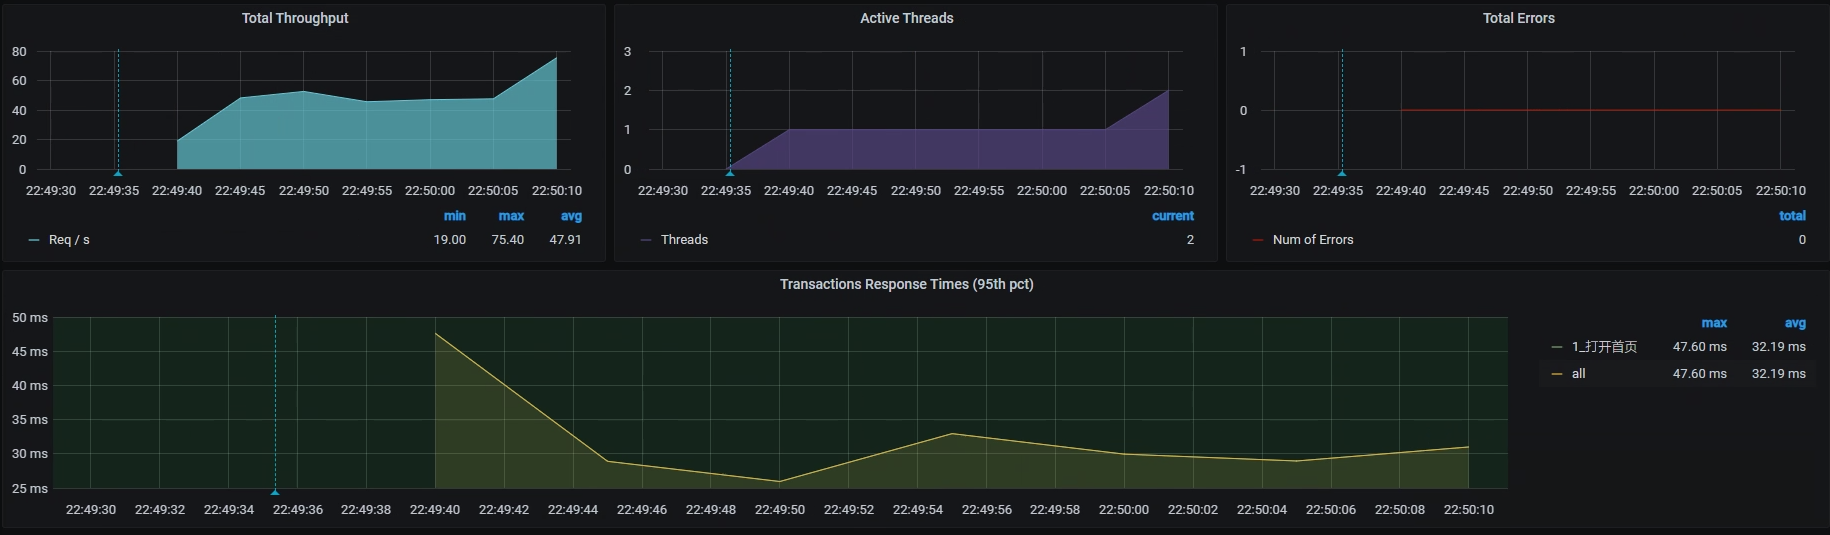
从结果来看,在一开始,一个线程会产生40左右的TPS。这里我们就要思考一下了:如果想要执行一个场景,并且这个场景可以压出打开首页接口的最大TPS,我们应该怎么设置压力工具中的线程数、递增策略和持续执行策略呢?
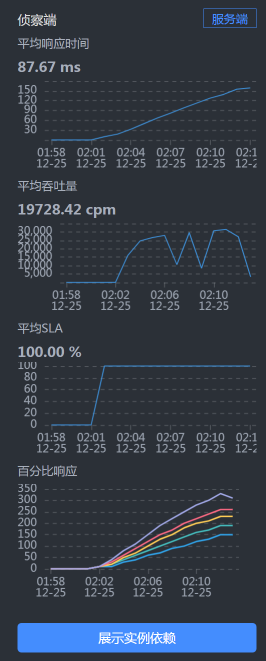
对此,我们先看看Portal应用节点所在机器的硬件使用情况,了解一下TPS趋势和资源使用率之间的关系。这个机器的情况如下图所示(注意,我跳过了Gateway所在的节点):
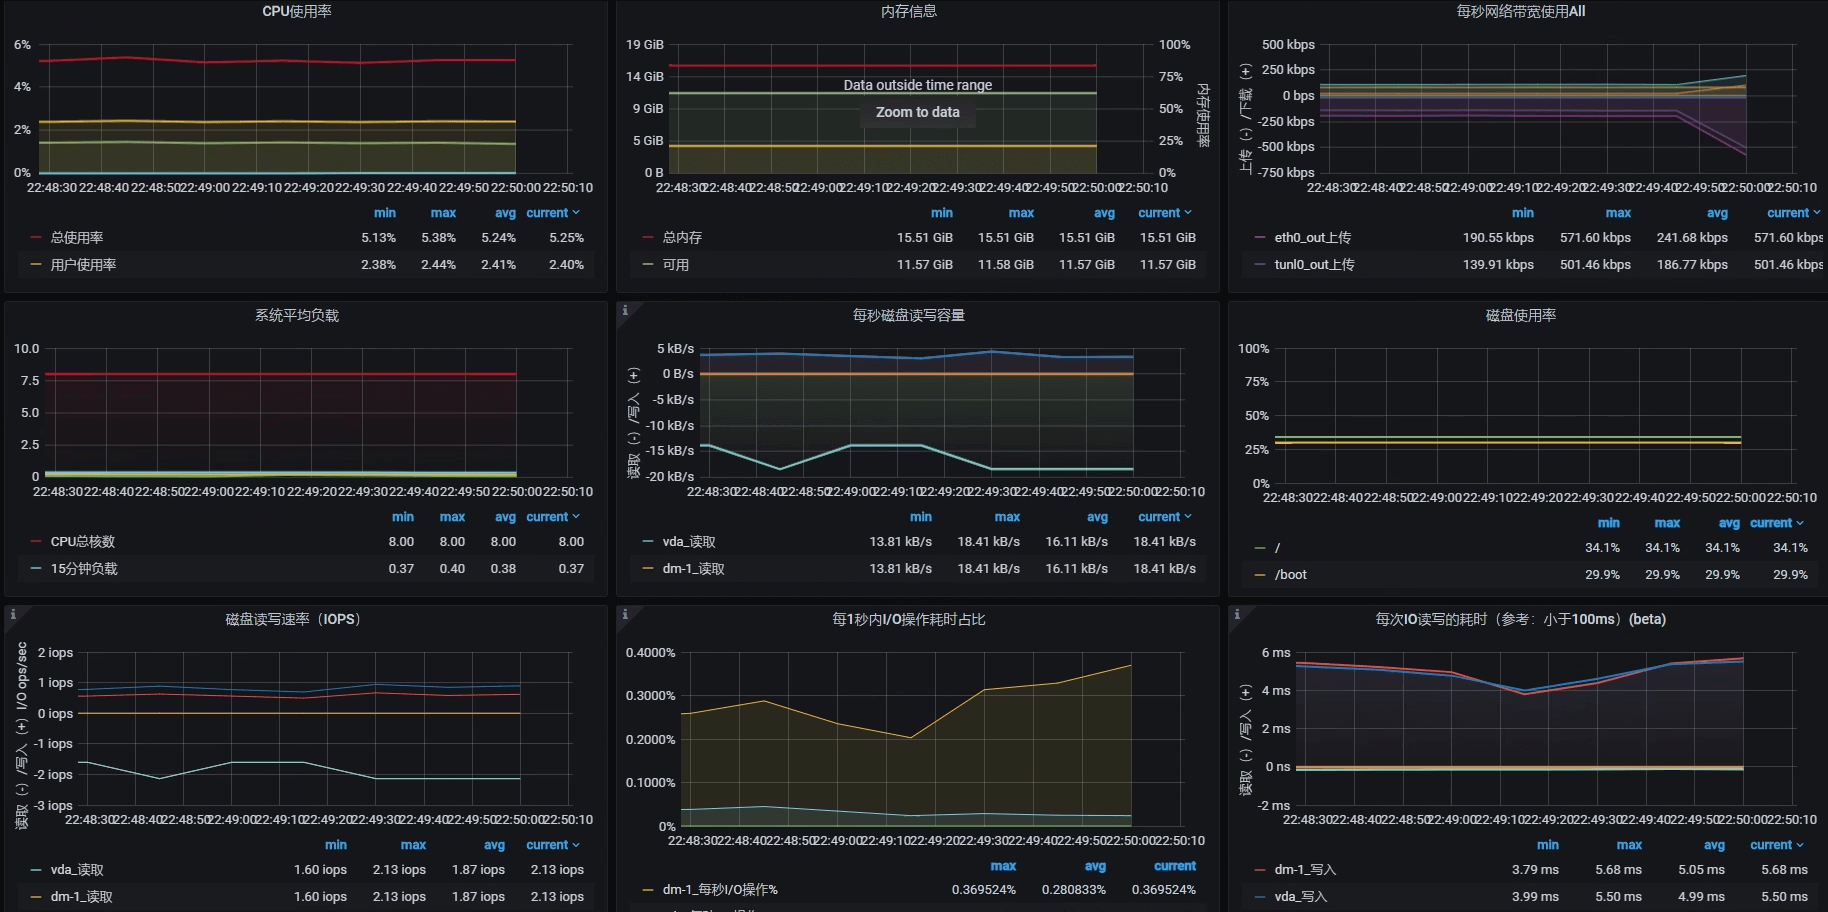
可以看到,当前Portal节点所在的机器是8C16G(虚拟机),并且这个机器基本上没什么压力。
现在我们先不计算其他资源,只考虑8C16G的配置情况。如果TPS是线性增长的话,那么当该机器的CPU使用率达到 100%的时候,TPS大概就是800左右。因此,我们压力工具中的线程数应该设置为:
\[ 线程数 = 800 TPS \\div 40 TPS = 20 个线程\]
不过,在压力持续的过程中,TPS和资源使用率之间的等比关系应该是做不到的。因为在压力过程中,各种资源的消耗都会增加一些响应时间,这些也都属于正常的响应时间损耗。
在确定了压力工具的线程数之后,我们再来看递增策略怎么设置。
我希望递增时间可以增加得慢一些,以便于我们查看各环节性能数据的反应。根据第2讲中的性能分析决策树,在这样的场景中,我们有不少计数器需要分析查看,所以我设置为30秒上一个线程,也就是说递增周期为600秒。
在确定好压力参数后,我们的试运行场景就可以在JMeter中设置为如下值:
 <stringProp name="ThreadGroup.num_threads">20</stringProp>
        <stringProp name="ThreadGroup.ramp_time">600</stringProp>
        <boolProp name="ThreadGroup.scheduler">true</boolProp>
        <stringProp name="ThreadGroup.duration">700</stringProp>
设置好试运行参数后,我们就可以在这样的场景下进一步设置足够的线程来运行,以达到资源使用率的最大化。
你可能会疑惑:难道不用更高的线程了吗?如果你想做一个正常的场景,那确实不需要用更高的线程了;如果你就是想知道压力线程加多了是什么样子,那你可以试试。我在性能场景执行时,也经常用各种方式压着玩。
不过,话说回来,确实有一种情况需要我们正儿八经地增加更多的压力,那就是你的响应时间已经增加了,可是增加得又不多,TPS也不再上升。这时候,我们拆分响应时间是比较困难的,特别是当一些系统很快的时候,响应时间可能只是几个毫秒之间。所以,在这种情况下,我们需要多增加一些线程,让响应时间慢的地方更清晰地表现出来,这样也就更容易拆分时间。
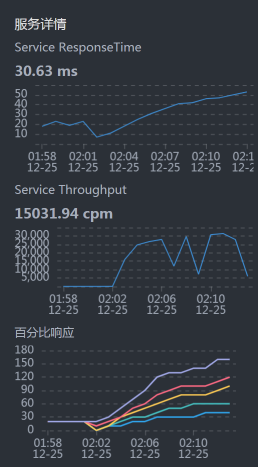
通过压力场景的递增设置(前面算的是只需要20个线程即可达到最大值,而这里,我把压力线程设置为100启动场景,目的是为了看到递增到更大压力时的TPS趋势以及响应时间的增加,这样更容易做时间的拆分),我们看到这个接口的响应时间确实在慢慢增加,并且随着线程数的增加,响应时间很快就上升到了几百毫秒。这是一个明显的瓶颈,我们自然是不能接受的。
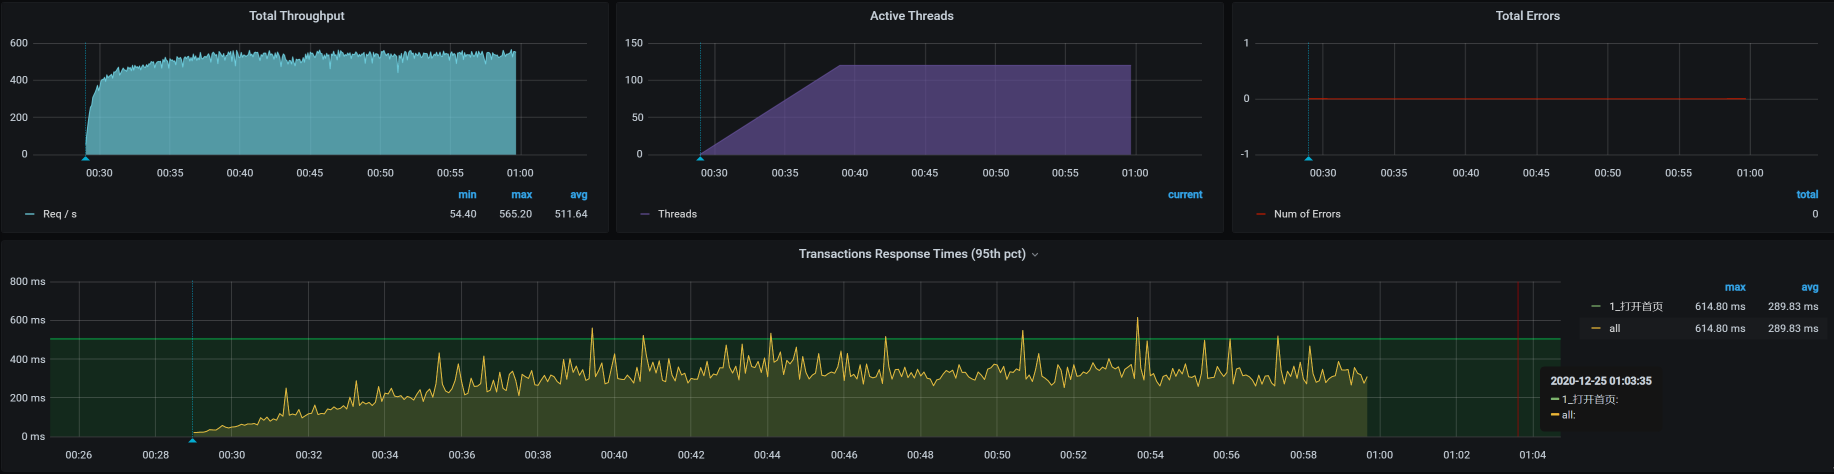
接下来,我们就要好好分析一下这个响应时间究竟消耗到了哪里。
拆分时间
我们前面提到,打开首页的逻辑是:User - Gateway(Redis)- Portal - (Redis,MySQL),那我们就按照这个逻辑,借助链路监控工具SkyWalking把响应时间具体拆分一下。
- User —Gateway之间的时间消耗
我们看到,User - Gateway之间的时间消耗慢慢上升到了150毫秒左右。
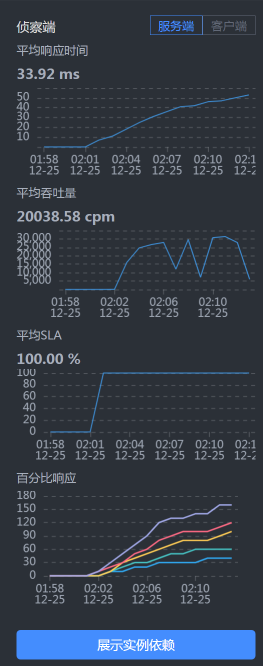
- Gateway响应时间
gateway上也消耗了150毫秒,这就说明user到gateway之间的网络并没有多少时间消耗,在毫秒级。
- Gateway —Portal之间的时间消耗
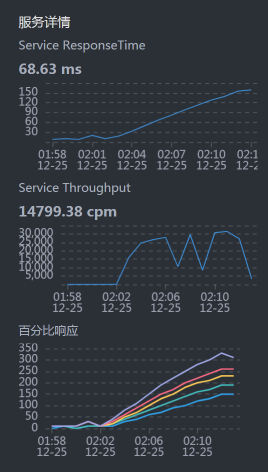
在Portal上,响应时间只消耗了50毫秒左右。我们再到Portal上看一眼。
- Portal响应时间
Portal的响应时间是50毫秒左右,和我们上面看到的时间一致。
通过上述对响应时间的拆分,我们可以确定是Gateway消耗了响应时间,并且这个时间达到了近100毫秒。所以,我们下一步定位的目标就是Gateway了。
定位Gateway上的响应时间消耗
第一阶段:分析st cpu
既然Gateway上的响应时间消耗很高,我们自然就要查一下这台主机把时间消耗在了哪里。
我们的分析逻辑仍然是先看全局监控,后看定向监控。全局监控要从整个架构开始看起,然后再确定某个节点上的资源消耗。注意,在看全局监控时,我们要从最基础的查起,而分析的过程中最基础的就是操作系统了。
通过top命令,我们可以看到Gateway节点上的资源情况,具体如下:
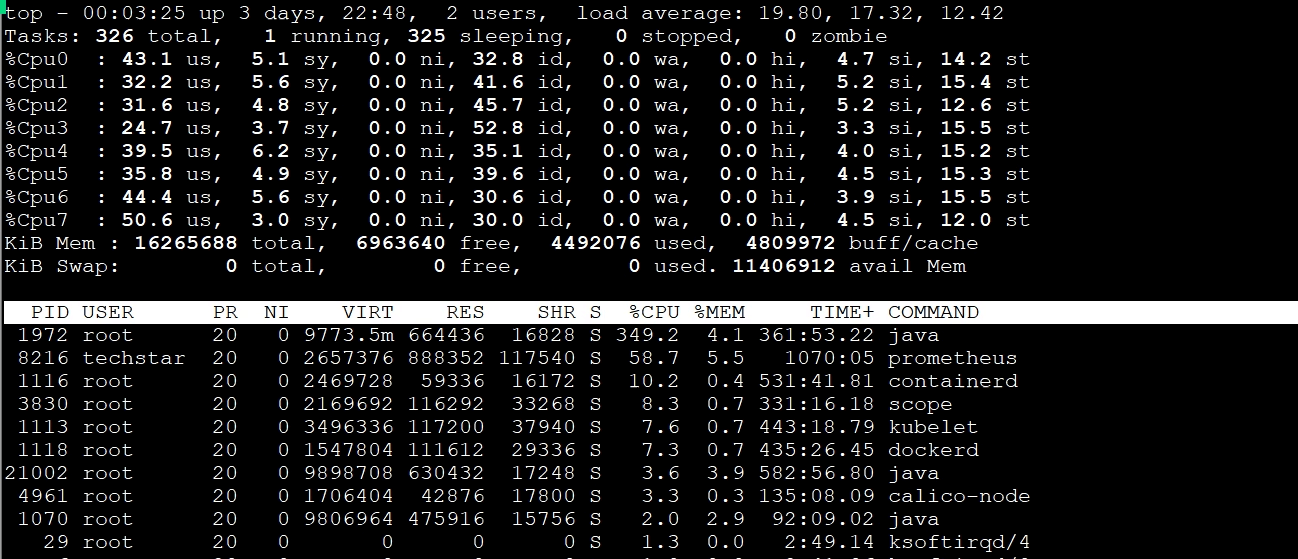
其中,st cpu达到了15%左右。我们知道,st cpu是指虚拟机被宿主机上的其他应用或虚拟机抢走的CPU,它的值这么高显然是不太正常的。所以,我们要进一步查看st cpu异常的原因。
我们用mpstat命令先来看看宿主机(运行Gateway的虚拟机所在的物理机)上的资源表现:
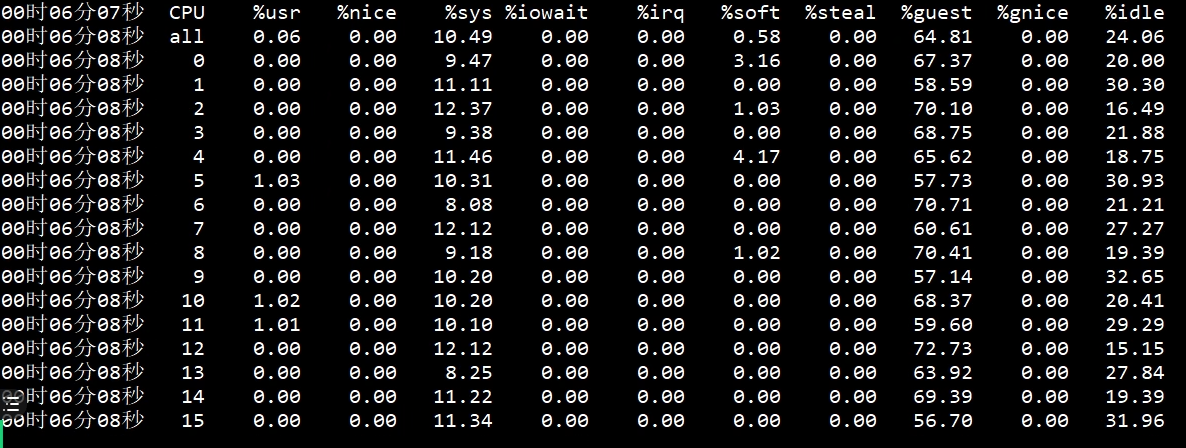
可以看到,CPU还有20%没有用完,说明宿主机还有空间。不过,宿主机的CPU使用率已经不小了,而消耗这些宿主机的就只有虚拟机里的应用。所以,我们要查一下是不是某个虚拟机的CPU消耗特别高。宿主机上的KVM列表如下:
  [root@dell-server-3 ~]# virsh list --all
 Id    名称                         状态
----------------------------------------------------
 12    vm-jmeter                      running
 13    vm-k8s-worker-8                running
 14    vm-k8s-worker-7                running
 15    vm-k8s-worker-9                running

[root@dell-server-3 ~]#
可以看到,在这个宿主机上跑了四个虚拟机,那我们就具体看一下这四个虚拟机的资源消耗情况。
- vm-jmeter
   top - 23:42:49 up 28 days,  8:14,  6 users,  load average: 0.61, 0.48, 0.38
Tasks: 220 total,   1 running, 218 sleeping,   1 stopped,   0 zombie
%Cpu0  :  6.6 us,  3.5 sy,  0.0 ni, 88.5 id,  0.0 wa,  0.0 hi,  0.0 si,  1.4 st
%Cpu1  :  6.5 us,  1.8 sy,  0.0 ni, 88.2 id,  0.0 wa,  0.0 hi,  0.4 si,  3.2 st
KiB Mem :  3880180 total,   920804 free,  1506128 used,  1453248 buff/cache
KiB Swap:  2097148 total,  1256572 free,   840576 used.  2097412 avail Mem

  PID USER      PR  NI    VIRT    RES    SHR S  %CPU %MEM     TIME+ COMMAND
 7157 root      20   0 3699292 781204  17584 S  27.8 20.1   1:09.44 java
    9 root      20   0       0      0      0 S   0.3  0.0  30:25.77 rcu_sched
  376 root      20   0       0      0      0 S   0.3  0.0  16:40.44 xfsaild/dm-
- vm-k8s-worker-8
top - 23:43:47 up 5 days, 22:28,  3 users,  load average: 9.21, 6.45, 5.74
Tasks: 326 total,   1 running, 325 sleeping,   0 stopped,   0 zombie
%Cpu0  : 20.2 us,  3.7 sy,  0.0 ni, 60.7 id,  0.0 wa,  0.0 hi,  2.9 si, 12.5 st
%Cpu1  : 27.3 us,  7.4 sy,  0.0 ni, 50.2 id,  0.0 wa,  0.0 hi,  3.7 si, 11.4 st
%Cpu2  : 29.9 us,  5.6 sy,  0.0 ni, 48.5 id,  0.0 wa,  0.0 hi,  4.9 si, 11.2 st
%Cpu3  : 31.2 us,  5.6 sy,  0.0 ni, 47.6 id,  0.0 wa,  0.0 hi,  4.5 si, 11.2 st
%Cpu4  : 25.6 us,  4.3 sy,  0.0 ni, 52.7 id,  0.0 wa,  0.0 hi,  3.6 si, 13.7 st
%Cpu5  : 26.0 us,  5.2 sy,  0.0 ni, 53.5 id,  0.0 wa,  0.0 hi,  4.1 si, 11.2 st
%Cpu6  : 19.9 us,  6.2 sy,  0.0 ni, 57.6 id,  0.0 wa,  0.0 hi,  3.6 si, 12.7 st
%Cpu7  : 27.3 us,  5.0 sy,  0.0 ni, 53.8 id,  0.0 wa,  0.0 hi,  2.3 si, 11.5 st
KiB Mem : 16265688 total,  6772084 free,  4437840 used,  5055764 buff/cache
KiB Swap:        0 total,        0 free,        0 used. 11452900 avail Mem

  PID USER      PR  NI    VIRT    RES    SHR S  %CPU %MEM     TIME+ COMMAND
13049 root      20   0 9853712 593464  15752 S 288.4  3.6  67:24.22 java
 1116 root      20   0 2469728  57932  16188 S  12.6  0.4 818:40.25 containerd
 1113 root      20   0 3496336 118048  38048 S  12.3  0.7 692:30.79 kubelet
 4961 root      20   0 1780136  40700  17864 S  12.3  0.3 205:51.15 calico-node
 3830 root      20   0 2170204 114920  33304 S  11.6  0.7 508:00.00 scope
 1118 root      20   0 1548060 111768  29336 S  11.3  0.7 685:27.95 dockerd
 8216 techstar  20   0 2747240 907080 114836 S   5.0  5.6   1643:33 prometheus
21002 root      20   0 9898708 637616  17316 S   3.3  3.9 718:56.99 java
 1070 root      20   0 9806964 476716  15756 S   2.0  2.9 137:13.47 java
11492 root      20   0  441996  33204   4236 S   1.3  0.2  38:10.49 gvfs-udisks2-vo
- vm-k8s-worker-7
top - 23:44:22 up 5 days, 22:26,  3 users,  load average: 2.50, 1.67, 1.13
Tasks: 308 total,   1 running, 307 sleeping,   0 stopped,   0 zombie
%Cpu0  :  4.2 us,  3.5 sy,  0.0 ni, 82.3 id,  0.0 wa,  0.0 hi,  1.7 si,  8.3 st
%Cpu1  :  6.2 us,  2.7 sy,  0.0 ni, 82.8 id,  0.0 wa,  0.0 hi,  1.4 si,  6.9 st
%Cpu2  :  5.2 us,  2.8 sy,  0.0 ni, 84.0 id,  0.0 wa,  0.0 hi,  1.0 si,  6.9 st
%Cpu3  :  4.5 us,  3.8 sy,  0.0 ni, 81.2 id,  0.0 wa,  0.0 hi,  1.4 si,  9.2 st
%Cpu4  :  4.4 us,  2.4 sy,  0.0 ni, 83.3 id,  0.0 wa,  0.0 hi,  1.4 si,  8.5 st
%Cpu5  :  5.5 us,  2.4 sy,  0.0 ni, 84.5 id,  0.0 wa,  0.0 hi,  1.0 si,  6.6 st
%Cpu6  :  3.7 us,  2.7 sy,  0.0 ni, 85.6 id,  0.0 wa,  0.0 hi,  0.7 si,  7.4 st
%Cpu7  :  3.1 us,  1.7 sy,  0.0 ni, 84.7 id,  0.0 wa,  0.0 hi,  1.4 si,  9.0 st
KiB Mem : 16265688 total,  8715820 free,  3848432 used,  3701436 buff/cache
KiB Swap:        0 total,        0 free,        0 used. 12019164 avail Mem

  PID USER      PR  NI    VIRT    RES    SHR S  %CPU %MEM     TIME+ COMMAND
18592 27        20   0 4588208 271564  12196 S  66.9  1.7 154:58.93 mysqld
 1109 root      20   0 2381424 105512  37208 S   9.6  0.6 514:18.00 kubelet
 1113 root      20   0 1928952  55556  16024 S   8.9  0.3 567:43.53 containerd
 1114 root      20   0 1268692 105212  29644 S   8.6  0.6 516:43.38 dockerd
 3122 root      20   0 2169692 117212  33416 S   7.0  0.7 408:21.79 scope
 4132 root      20   0 1780136  43188  17952 S   6.0  0.3 193:27.58 calico-node
 3203 nfsnobo+  20   0  116748  19720   5864 S   2.0  0.1  42:43.57 node_exporter
12089 techstar  20   0 5666480   1.3g  23084 S   1.3  8.5  78:04.61 java
 5727 root      20   0  449428  38616   4236 S   1.0  0.2  49:02.98 gvfs-udisks2-vo
- vm-k8s-worker-9
 top - 23:45:23 up 5 days, 22:21,  4 users,  load average: 12.51, 10.28, 9.19
Tasks: 333 total,   4 running, 329 sleeping,   0 stopped,   0 zombie
%Cpu0  : 20.1 us,  7.5 sy,  0.0 ni, 43.3 id,  0.0 wa,  0.0 hi, 13.4 si, 15.7 st
%Cpu1  : 20.1 us, 11.2 sy,  0.0 ni, 41.4 id,  0.0 wa,  0.0 hi, 11.9 si, 15.3 st
%Cpu2  : 23.8 us, 10.0 sy,  0.0 ni, 35.4 id,  0.0 wa,  0.0 hi, 14.2 si, 16.5 st
%Cpu3  : 15.1 us,  7.7 sy,  0.0 ni, 49.1 id,  0.0 wa,  0.0 hi, 12.2 si, 15.9 st
%Cpu4  : 22.8 us,  6.9 sy,  0.0 ni, 40.5 id,  0.0 wa,  0.0 hi, 14.7 si, 15.1 st
%Cpu5  : 17.5 us,  5.8 sy,  0.0 ni, 50.0 id,  0.0 wa,  0.0 hi, 10.6 si, 16.1 st
%Cpu6  : 22.0 us,  6.6 sy,  0.0 ni, 45.1 id,  0.0 wa,  0.0 hi, 11.0 si, 15.4 st
%Cpu7  : 19.2 us,  8.0 sy,  0.0 ni, 44.9 id,  0.0 wa,  0.0 hi,  9.8 si, 18.1 st
KiB Mem : 16265688 total,  2567932 free,  7138952 used,  6558804 buff/cache
KiB Swap:        0 total,        0 free,        0 used.  8736000 avail Mem

  PID USER      PR  NI    VIRT    RES    SHR S  %CPU %MEM     TIME+ COMMAND
24122 root      20   0 9890064 612108  16880 S 201.0  3.8   1905:11 java
 2794 root      20   0 2307652 161224  33464 S  57.7  1.0   1065:54 scope
 1113 root      20   0 2607908  60552  15484 S  13.8  0.4   1008:04 containerd
 1109 root      20   0 2291748 110768  39140 S  12.8  0.7 722:41.17 kubelet
 1114 root      20   0 1285500 108664  30112 S  11.1  0.7 826:56.51 dockerd
   29 root      20   0       0      0      0 S   8.9  0.0  32:09.89 ksoftirqd/4
    6 root      20   0       0      0      0 S   8.2  0.0  41:28.14 ksoftirqd/0
   24 root      20   0       0      0      0 R   8.2  0.0  41:00.46 ksoftirqd/3
   39 root      20   0       0      0      0 R   8.2  0.0  41:08.18 ksoftirqd/6
   19 root      20   0       0      0      0 S   7.9  0.0  39:10.22 ksoftirqd/2
   14 root      20   0       0      0      0 S   6.2  0.0  40:58.25 ksoftirqd/1
很显然,worker-9的si(中断使用的CPU)和st(被偷走的CPU)都不算低。那这种情况就比较奇怪了,虚拟机本身都没有很高的CPU使用率,为什么st还这么高呢?难道CPU只能用到这种程度?
来,我们接着查下去。
第二阶段:查看物理机CPU运行模式
在这个阶段,我们要查一下服务里有没有阻塞。就像前面提到的,我们要从全局监控的角度,来考虑所查看的性能分析计数器是不是完整,以免出现判断上的偏差。不过,我去查看了线程栈的具体内容,看到线程栈中并没有Blocked啥的,那我们就只能再回到物理机的配置里看了。
那对于物理机CPU,我们还有什么可看的呢?即使你盖上被子蒙着头想很久,从下到上把所有的逻辑都理一遍,也找不出什么地方会有阻塞。那我们就只有看宿主机的CPU运行模式了。
-- 物理机器1
[root@hp-server ~]# cpupower frequency-info
analyzing CPU 0:
  driver: pcc-cpufreq
  CPUs which run at the same hardware frequency: 0
  CPUs which need to have their frequency coordinated by software: 0
  maximum transition latency:  Cannot determine or is not supported.
  hardware limits: 1.20 GHz - 2.10 GHz
  available cpufreq governors: conservative userspace powersave ondemand performance
  current policy: frequency should be within 1.20 GHz and 2.10 GHz.
                  The governor "conservative" may decide which speed to use
                  within this range.
  current CPU frequency: 1.55 GHz (asserted by call to hardware)
  boost state support:
    Supported: yes
    Active: yes

-- 物理机器2
[root@dell-server-2 ~]# cat /sys/devices/system/cpu/cpu0/cpufreq/scaling_governor
powersave
[root@dell-server-2 ~]# cpupower frequency-info
analyzing CPU 0:
  driver: intel_pstate
  CPUs which run at the same hardware frequency: 0
  CPUs which need to have their frequency coordinated by software: 0
  maximum transition latency:  Cannot determine or is not supported.
  hardware limits: 1.20 GHz - 2.20 GHz
  available cpufreq governors: performance powersave
  current policy: frequency should be within 1.20 GHz and 2.20 GHz.
                  The governor "powersave" may decide which speed to use
                  within this range.
  current CPU frequency: 2.20 GHz (asserted by call to hardware)
  boost state support:
    Supported: no
    Active: no
    2200 MHz max turbo 4 active cores
    2200 MHz max turbo 3 active cores
    2200 MHz max turbo 2 active cores
    2200 MHz max turbo 1 active cores

-- 物理机器3
[root@dell-server-3 ~]# cpupower frequency-info
analyzing CPU 0:
  driver: intel_pstate
  CPUs which run at the same hardware frequency: 0
  CPUs which need to have their frequency coordinated by software: 0
  maximum transition latency:  Cannot determine or is not supported.
  hardware limits: 1.20 GHz - 2.20 GHz
  available cpufreq governors: performance powersave
  current policy: frequency should be within 1.20 GHz and 2.20 GHz.
                  The governor "powersave" may decide which speed to use
                  within this range.
  current CPU frequency: 2.20 GHz (asserted by call to hardware)
  boost state support:
    Supported: no
    Active: no
    2200 MHz max turbo 4 active cores
    2200 MHz max turbo 3 active cores
    2200 MHz max turbo 2 active cores
    2200 MHz max turbo 1 active cores

-- 物理机器4
[root@lenvo-nfs-server ~]# cpupower frequency-info
analyzing CPU 0:
  driver: acpi-cpufreq
  CPUs which run at the same hardware frequency: 0
  CPUs which need to have their frequency coordinated by software: 0
  maximum transition latency: 10.0 us
  hardware limits: 2.00 GHz - 2.83 GHz
  available frequency steps:  2.83 GHz, 2.00 GHz
  available cpufreq governors: conservative userspace powersave ondemand performance
  current policy: frequency should be within 2.00 GHz and 2.83 GHz.
                  The governor "conservative" may decide which speed to use
                  within this range.
  current CPU frequency: 2.00 GHz (asserted by call to hardware)
  boost state support:
    Supported: no
    Active: no
可以看到,没有一个物理机是运行在performance模式之下的。
在这里,我们需要对CPU的运行模式有一个了解:
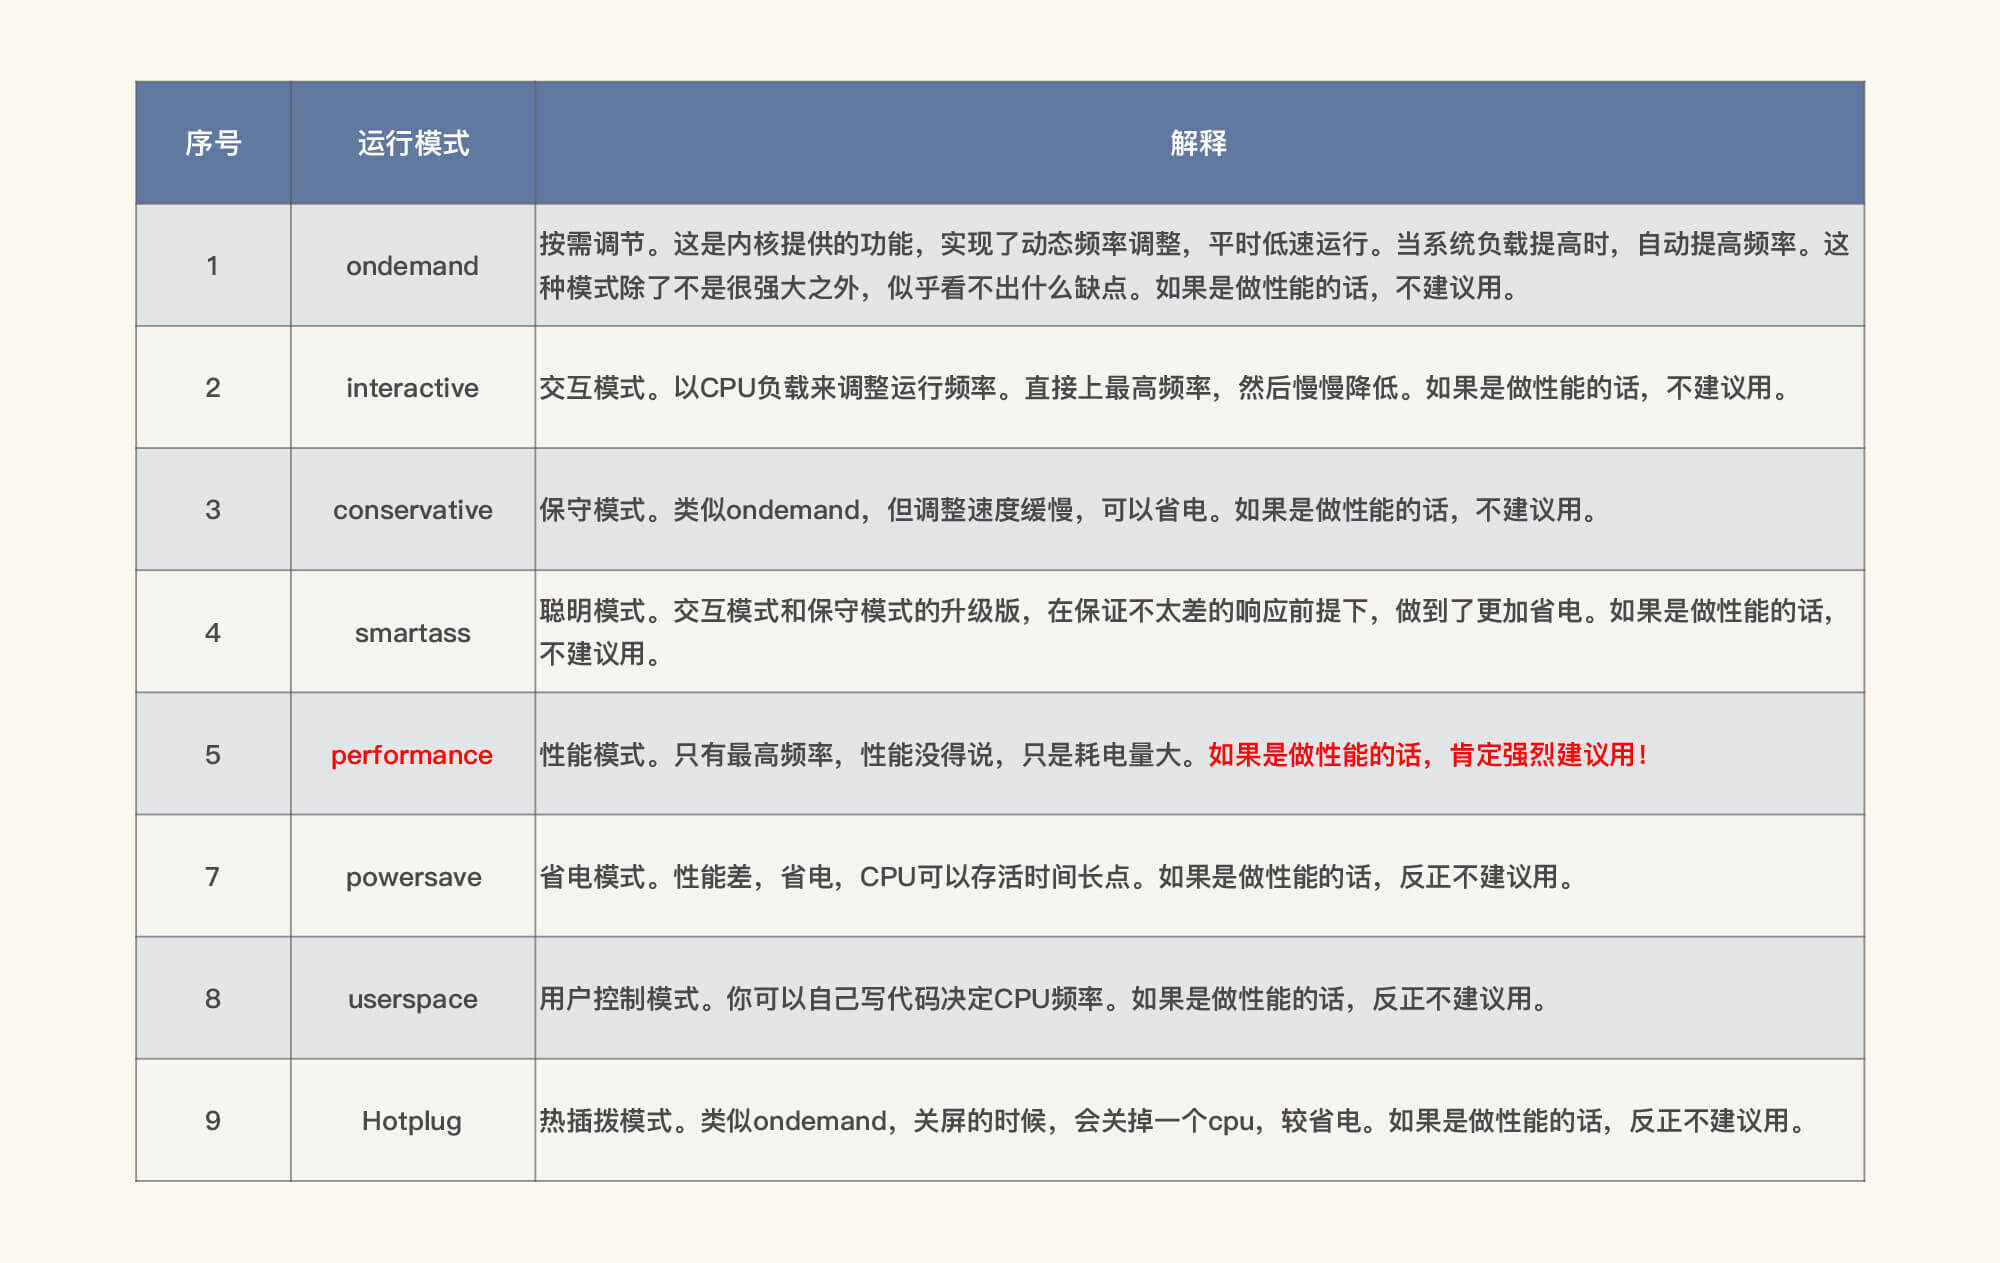
既然我们是性能分析人员,那自然要用performance模式了,所以我们把CPU模式修改如下:
-- 物理机器1
[root@hp-server ~]# cpupower -c all frequency-set -g performance
Setting cpu: 0
Setting cpu: 1
Setting cpu: 2
Setting cpu: 3
Setting cpu: 4
Setting cpu: 5
Setting cpu: 6
Setting cpu: 7
Setting cpu: 8
Setting cpu: 9
Setting cpu: 10
Setting cpu: 11
Setting cpu: 12
Setting cpu: 13
Setting cpu: 14
Setting cpu: 15
Setting cpu: 16
Setting cpu: 17
Setting cpu: 18
Setting cpu: 19
Setting cpu: 20
Setting cpu: 21
Setting cpu: 22
Setting cpu: 23
Setting cpu: 24
Setting cpu: 25
Setting cpu: 26
Setting cpu: 27
Setting cpu: 28
Setting cpu: 29
Setting cpu: 30
Setting cpu: 31
[root@hp-server ~]# cat /sys/devices/system/cpu/cpu0/cpufreq/scaling_governor
performance
[root@hp-server ~]#

-- 物理机器2
[root@dell-server-2 ~]# cat /sys/devices/system/cpu/cpu0/cpufreq/scaling_governor
powersave
[root@dell-server-2 ~]# cpupower -c all frequency-set -g performance
Setting cpu: 0
Setting cpu: 1
Setting cpu: 2
Setting cpu: 3
Setting cpu: 4
Setting cpu: 5
Setting cpu: 6
Setting cpu: 7
Setting cpu: 8
Setting cpu: 9
Setting cpu: 10
Setting cpu: 11
Setting cpu: 12
Setting cpu: 13
Setting cpu: 14
Setting cpu: 15
[root@dell-server-2 ~]# cat /sys/devices/system/cpu/cpu0/cpufreq/scaling_governor
performance
[root@dell-server-2 ~]#

-- 物理机器3
[root@dell-server-3 ~]# cat /sys/devices/system/cpu/cpu0/cpufreq/scaling_governor
powersave
[root@dell-server-3 ~]#  cat /sys/devices/system/cpu/cpu0/cpufreq/scaling_governor
powersave
[root@dell-server-3 ~]# cpupower -c all frequency-set -g performance
Setting cpu: 0
Setting cpu: 1
Setting cpu: 2
Setting cpu: 3
Setting cpu: 4
Setting cpu: 5
Setting cpu: 6
Setting cpu: 7
Setting cpu: 8
Setting cpu: 9
Setting cpu: 10
Setting cpu: 11
Setting cpu: 12
Setting cpu: 13
Setting cpu: 14
Setting cpu: 15
[root@dell-server-3 ~]#  cat /sys/devices/system/cpu/cpu0/cpufreq/scaling_governor
performance
[root@dell-server-3 ~]#

-- 物理机器4
[root@lenvo-nfs-server ~]# cpupower -c all frequency-set -g performance
Setting cpu: 0
Setting cpu: 1
Setting cpu: 2
Setting cpu: 3
[root@lenvo-nfs-server ~]# cat /sys/devices/system/cpu/cpu0/cpufreq/scaling_governor
performance
[root@lenvo-nfs-server ~]#
在我们一顿操作猛如虎之后,性能会怎么样呢?
结果,性能并没有好起来……这里我就不截图了,因为图和一开始的那张场景运行图一样。
在这里我们要知道,以上的分析过程说明不止是这个问题点,还有其他资源使用有短板我们没有找到。没办法,我们只能接着查。
总结
在这节课中,我们通过压力工具中的曲线,判断了瓶颈的存在。然后通过SkyWalking拆分了响应时间。
在确定了响应时间消耗点之后,我们又开始了两个阶段的分析:第一个阶段的证据链是从现象开始往下分析的,因为st cpu是指宿主机上的其他应用的消耗导致了此虚拟机的cpu资源被消耗,所以,我们去宿主机上去查了其他的虚拟机。这里我们要明确CPU资源应该用到什么样的程度,在发现了资源使用不合理之后,再接着做第二阶段的判断。
在第二阶段中,我们判断了CPU运行模式。在物理机中,如果我们自己不做主动的限制,CPU的消耗是没有默认限制的,所以我们才去查看CPU的运行模式。
但是,即便我们分析并尝试解决了以上的问题,TPS仍然没什么变化。可见,在计数器的分析逻辑中,虽然我们做了优化动作,但系统仍然有问题。只能说我们当前的优化手段,只解决了木桶中的最短板,但是其他短板,我们还没有找到。
请你注意,这并不是说我们这节课的分析优化过程没有意义。要知道,这些问题不解决,下一个问题也不会出现。所以,我们这节课的分析优化过程也非常有价值。
下节课,我们接着来找打开首页接口的性能瓶颈。
课后作业
最后,请你思考一下:
- 为什么我们看到虚拟机中st cpu高,就要去查看宿主机上的其他虚拟机?如果在宿主机上看到st cpu高,我们应该做怎样的判断?
- CPU的运行模式在powersave时,CPU的运行逻辑是什么?
记得在留言区和我讨论、交流你的想法,每一次思考都会让你更进一步。
如果这节课让你有所收获,也欢迎你分享给你的朋友,共同学习进步。我们下一讲再见!
© 2019 - 2023 Liangliang Lee. Powered by gin and hexo-theme-book.